

18 Nov The S&P 500 – A Meaningful Average? – 2018 Q4 Commentary
In his second quarter note to investors regarding his Gabelli Asset Fund, Mario Gabelli stated that during the first half of 2018 the FANGMA (Facebook, Amazon, Netflix, Alphabet, Microsoft, and Apple) stocks accounted for 2.5 percentage points of the 2.6 percentage point return to the S&P 500. Furthermore, Gabelli stated that the top 10 largest companies in the S&P 500 during the first half of 2018 accounted for 3.1 percentage points of the 2.6 percentage point return – [119%] of the total return. You might reasonably ask – how?
The how comes from the construction of the S&P 500. The S&P 500 consists of 500 US companies weighted by their market capitalizations, or the number of shares outstanding multiplied by the share price. With Apple over a $1 trillion market capitalization and Amazon pushing $1 trillion, those companies have a higher weight in the index and have a much larger impact on the returns to the index. For example, at the time of writing, PayPal had a market capitalization of $106.2 billion compared to Apple at $1.1 trillion. Therefore, despite PayPal being considered a mega-capitalization company in its own right, Apple has over 10x the impact on the return of the S&P 500 index as PayPal. To us it does not make a lot of sense to describe something as an “average,” if one of its constituents has a 10x greater weighting than another.
This perspective only amplifies when you take into account that if one divided the S&P 500 evenly each company would account for 0.2% (1/500) of the whole. At the end of 2017 Apple’s weighting amounted to 3.9%. Therefore, Apple affected performance of the S&P 500 by 19.5x more than if convention equally
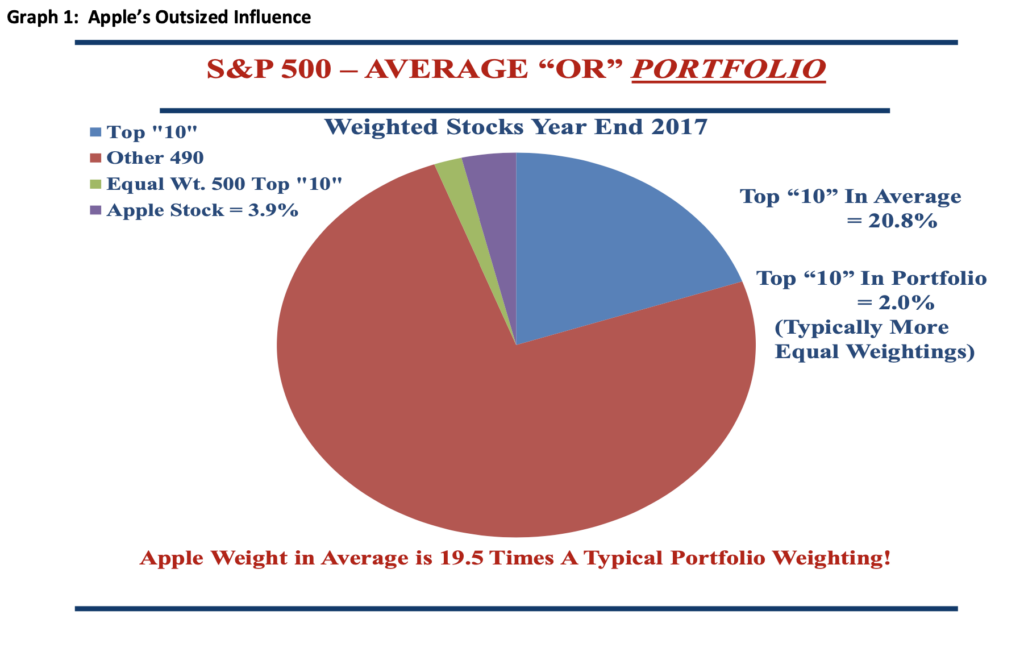
weighted the index. See Graph 1 above. The issues with S&P 500 index construction and the market capitalization weighting lead to the outsized return influence discussed above. We have answered the question of how the S&P 500 might experience the return dynamics covered in the first paragraph, but now you might reasonably ask whether the S&P 500 makes sense to use as an average return?
We believe that the S&P 500 does not represent a good average based on the dynamics above. We note that convention in the investment industry is to look at “averages” like the S&P 500, the Dow Jones Industrial Average (DJIA) and the NASDAQ – with each having its flaws. Compared to the S&P 500 the NASDAQ has an even greater portion of the index devoted to the top 10 largest companies. Meanwhile the DJIA includes only 30 companies and gets weighted based on the price of each stock. Although the stocks in the DJIA all represent large US companies, we do not see any basis for weighting an index or “average” by the arbitrary price of a share, which to a degree depends on where the initial shares of a given company came priced to market. In other words, a price weighted index does not make sense to use as an example of “average” return. Even though we would suggest a market weighted index makes more sense to use as an average, we would propose that an actively managed portfolio looks nothing like the S&P 500 – with the highest weighted position 19.5x what you would see in an equally weighted portfolio.
How the investing public thinks of the S&P 500 has evolved over the years, from thinking of it as an average stock market return to thinking of it as a portfolio that one can buy either through an index mutual fund or exchange traded fund (ETF). Taking something that investors initially viewed as representative of the average performance of the US stock market and “productizing” it can lead to positive outcomes, as seen over the last 10 years’ performance when large US stocks have outperformed, but it can also lead to negative outcomes as seen by the large companies and tech companies that led the market crash in the early 2000’s, while other companies’ stocks actually performed well. So the S&P 500 represents a poorly constructed stock average and an even more weakly constructed investment vehicle. A fiduciary would not build an investment portfolio that arbitrarily weighted the companies by size and then added to the largest companies as assets grew (i.e., on momentum), which is exactly what we see in the case of S&P 500 ETFs today.
A portfolio consists of a collection of assets weighted on the merits of their risk and return. With that in mind a portfolio may outperform or underperform the S&P 500 “average” over various periods of time but what does that mean? Based on what we have said above, not much. A poor average, which has become “productized” does not represent a portfolio most investors should target to beat on an annual basis. Any collection of assets can be “productized” on Wall Street but the S&P 500 “average” represents as arbitrary a collection as we have seen. If the large capitalization stocks begin to decline in value the index will follow suit. What if smaller capitalization company stocks do not follow their larger peers down? That is when a true portfolio will have the ability to change course and strategically weight investments that will perform better. The S&P 500 “average” or index does not have that ability.
As always, thank you for your trust and we continue to work hard to protect and grow your assets.
Sorry, the comment form is closed at this time.