

25 Nov Where are We? – 2017 Q4 Commentary
As the S&P 500’s bull market carries on, we tend to field more questions along the lines of, “have we reached a top?” The questions typically stem from geopolitical concerns, economic growth concerns, valuation concerns, the concern that the S&P 500 has run too far for too long, among several others. We view all of these types of concerns as reasonable. In this newsletter we will address a couple of these questions. However, we note that we must live with a certain amount of volatility. Exhibit 1 demonstrates that in 41% of all months we deal with an S&P 500 decline of 5% or greater and in 26% of all months we deal with an S&P 500 decline of 10% or greater.

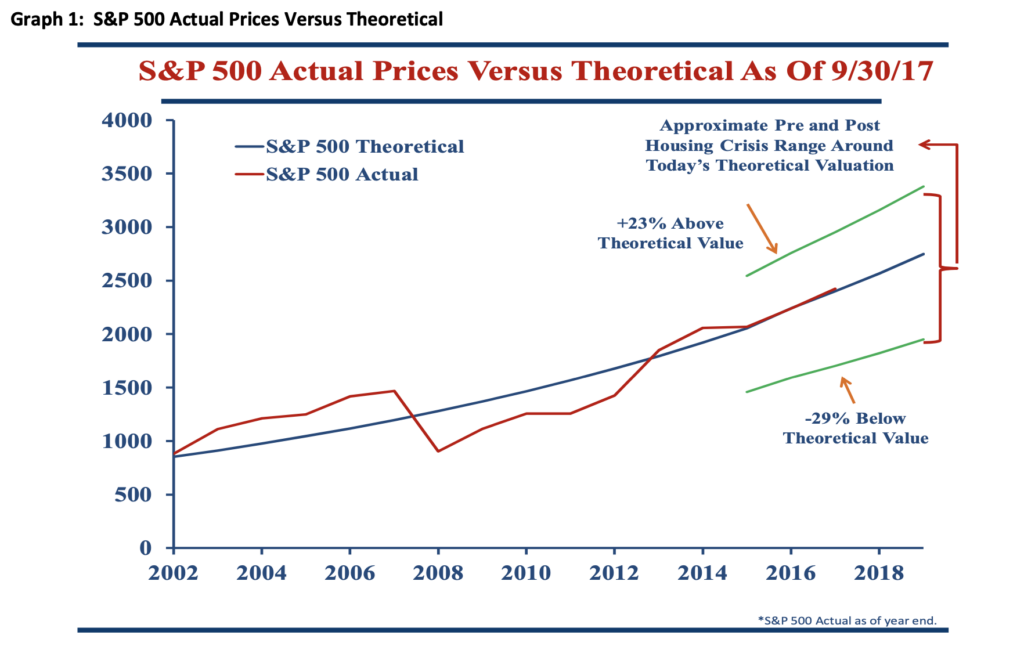
Having noted the kind of volatility we have historically managed through, we would like to look at today and the question of the S&P 500’s valuation. As we have discussed before, we do not believe, based on our normalized earnings calculation for S&P 500 companies, that the S&P 500 is overvalued. Looking at Graph 1 below, we see that the actual S&P 500 lies directly on our theoretical S&P 500, implying fair valuation instead of over valuation. The green lines demark where the actual S&P 500 stood above our theoretical S&P 500 in 2007, before the housing crash, as well as where the actual S&P 500 stood below our theoretical S&P 500 in early 2009, before the index rallied. We suggest to you that today we do not see the number of high quality investment opportunities that we saw in early 2009, though nor do we see the number of low quality investment opportunities that we saw in 2007. Therefore, we continue to invest your assets in companies growing their earnings faster than gross domestic product (GDP) with a sound financial position.
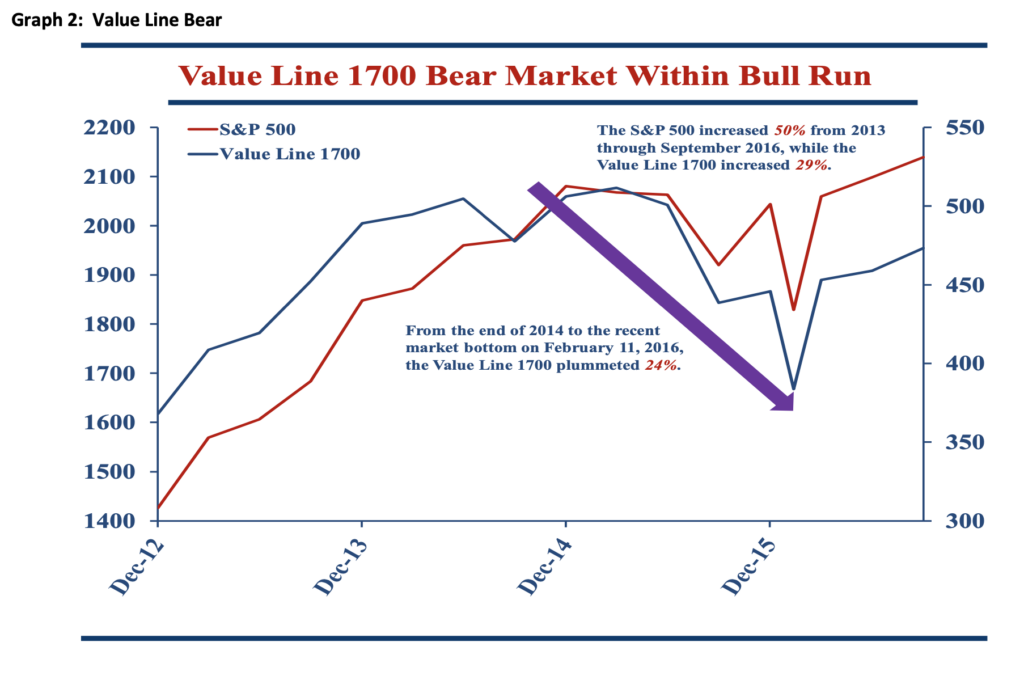
As a refresher from the fourth quarter newsletter a year ago, but germane to this topic, we would like to discuss the idea of the S&P 500 correcting because it has not done so in eight years. Graph 2, above, demonstrates that during 2015 the S&P declined approximately 9% to a short-term bottom in early 2016. During the same period the Value 1700, the largest 1700 US companies equal weighted, declined 24% – meeting the down 20% definition of a bear market. Therefore, we suggest to you that the “average stock” has gone through a bear market during the last nine years. Thus, the S&P 500, or the top portion of that index, might correct following this nine year run. However, the average stock does not “have to correct” as some market pundits suggest.
Using the above information and knowing that we cannot predict geopolitical events or estimate economic growth precisely, we continue to stick to our established strategy. The certain volatility explained at the beginning of this newsletter will be what, in part, provides us the future opportunity for new investments. We hope to capitalize on that opportunity as we have during the last 40 years. Thank you for your continued support and trust!
Sorry, the comment form is closed at this time.